Have you ever had a frozen program that refuses to close or disappear? An annoying problem is when a poorly written application crashes and refuses to be closed. Or maybe you’ve noticed your computer running slow, but there’s no clear indication why? If so, you may have a process running on your system that is taking up CPU or taking up a lot of memory.
Well, the Windows Task Manager can help you in some of these situations to determine the cause and terminate the problematic application. First of all, the task manager’s purpose is to provide information about the computer’s performance along with details about the programs, processes, and services currently running. It also provides the ability to monitor network traffic if you are connected to a network.
How Task Manager opens
So let’s start by learning this very useful tool in Windows 10. You can access the Task Manager in a few ways:
- Press Ctrl + Shift + ESC while holding down each key. Just like you would Ctrl + Alt + Del, which I think most people have done by now.
- The other way is to press the second key combination mentioned above, Ctrl + Alt + Del, then click on the Task Manager shortcut.
- Press Windows key + X or right-click the Start button and the power menu will appear, which has a shortcut to the task manager.
Task Manager overview
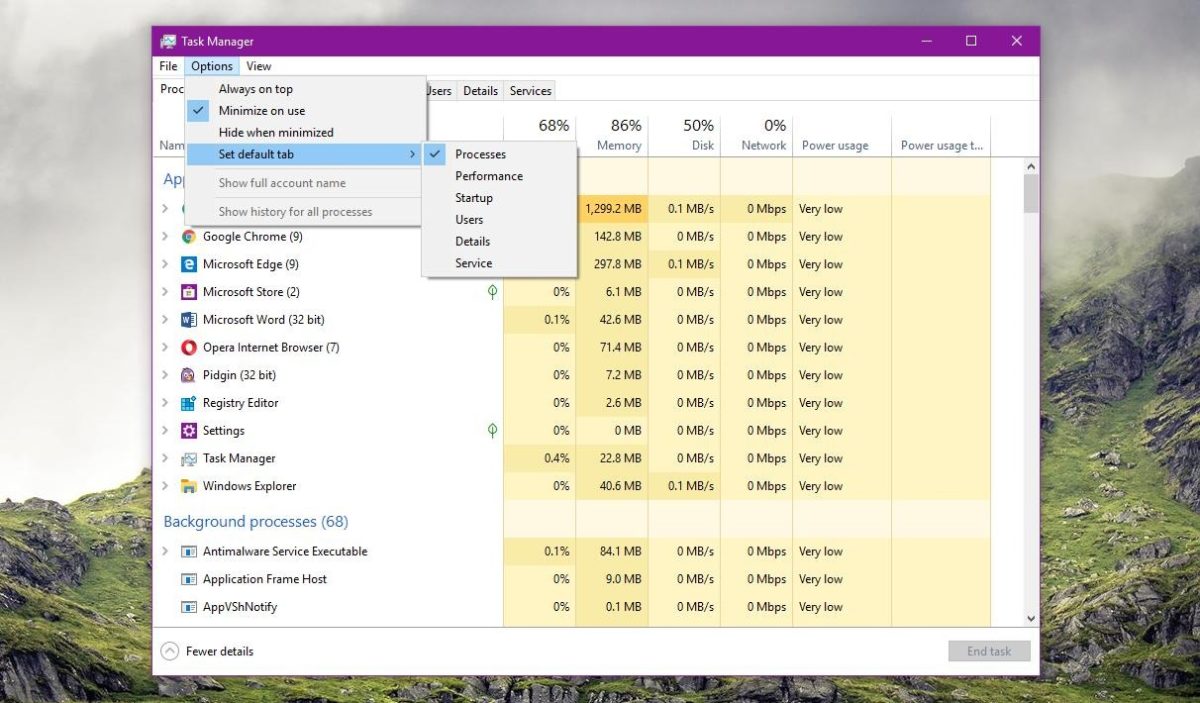
You should now see the Task Manager dialog on your computer screen. By default, in Windows 10, you’ll see the stripped-down version, which only gives you a list of running applications.
To close a non-responsive program, simply click on it and click the End Task button. Since most people will only use the task manager for this purpose, Microsoft has decided to hide all the extra details unless someone really wants to see it.
Since we want to see more of the apps running on our computer, click on More details. This will bring up the task manager with all tabs.
Processes, Details, and Services tabs
By default, the Processes tab will be displayed. The list of processes is divided into three main categories- apps, background processes, and Windows processes. The apps will give you a list of all the programs currently running on your PC. These are the ones that appear on the taskbar or in the taskbar.
Background processes are all Windows Store apps and third-party apps running on the system. Some of the processes here may be running in the system tray. Most of the others are background processes that will remain inactive until the program is opened or when a scheduled task runs.
The Windows Processes section consists of all the main processes required for the proper functioning of Windows 10. It mainly consists of many Service Host processes (svchost.exe).
You can use this tab to get detailed information on resource usage for each process running on your system. It’s a quick way to diagnose a slow computer if a process is taking up 95% of the CPU, for example. Or, if a program causes disk usage up to 100%, you can see it here.
The Processes tab is also useful for restarting Explorer. All you have to do is right-click on Windows Explorer and choose Restart. In previous versions of Windows, you had to terminate the process and then run a new explorer.exe task, which was a problem.
When you right-click on a process, you will get a list of actions you can perform on that process.
You can end the task, create a dump file, go to the details, open the file path, search online, or see the properties. Finish the task will go ahead and finish the process. Create a dump file is only used by developers and you will never have to worry about it. Go to details will take you to the Details tab, where you can see the process ID.
Under the Description heading, you will get more information about the company or program associated with that process. Another good option is the Search Online link. If you’re not sure what a process does or where it came from, click Search Online and it will search for that EXE file along with the description. The location of the open file is useful if you want to know the location of the EXE file on your computer.
Finally, on the Details tab, if you right-click on a process, you will also see an option to access the services tab. Note that you can set priority and set affinity for the process here. You should never really change these values for any process unless you know what you are doing.
If the process has a service associated with it, it will take you to the Services tab and highlight that particular service. However, not all processes have a service associated with them.
Here you can right-click to start or stop a service, and you can also open the services console from here. This screen will show you all the services on the system and show you which ones are running and which have been stopped.
Performance tab
The Performance tab is probably my favorite in the task manager. It allows you to see in real-time how much your various components are taxed. At the top is the CPU, which will be the default selection when you click on the tab.
In the right pane, you will see a usage graph and lots of useful information about your processor. At the top, it will give you the name of the CPU, which in my case is an Intel Core i7-8700K. At the bottom right, you will see the base clock speed, the number of CPU sockets, the number of cores, the number of logical processors (if your CPU supports hyper-threading), if virtualization is supported, and the CPU cache size.
On the left, you’ll get real-time usage and real-time processor speed. You will also see the total number of processes, threads and handles. Above, the CPU graph shows the overall CPU usage, but if you want to see every single core, simply right-click the graph, click Change Graph to and then click Logical Processors.
If you click on Memory, you will get a graph showing the amount of memory currently used. At the top, is the total amount of memory installed on the system (32GB in my case).
You will also get useful information such as your memory speed (3000 MHz to me), how many slots are being used (2 out of 4), and the form factor (DIMM). On the left are a number of technical details about exactly how much memory is in use and the amount of paged and non-paged memory.
For disks, you will see a graph for each hard drive you have installed on your system. In my case, I have three hard drives, so I have three graphs (C, D, E). Below is the chart for the system unit (C).
There is not much information on this tab other than the disc model/brand, read/write speed, average response time, and disc size.
If you have more than one network card, you will also see multiple Ethernet graphs. In my case, I have two network cards, but only one is connected.
Ethernet graphics are usually pretty bare unless you are actively downloading/uploading something. Above, I started a speed test, which was in the loading phase when I got the screenshot. Hence, the send value is at 721 Mbps. It is worth noting that the Throughput value at the top changes depending on the amount of bandwidth used.
Finally, if you have a dedicated video card, you will also see a GPU graph. If you have multiple graphics cards, you will get more graphics. The make and model of the card will be listed at the top.
At the bottom, you will get information about the installed driver version and supported DirectX version. You will also get information about dedicated GPU memory and shared memory. The charts also break down the GPU usage by activity- 3D, Copy, Video Encode, and Video Decode.
So this is a detailed look into the Performance tab. Related to the performance tab is the App History tab.
Windows 10 includes many built-in Windows Store apps, and this tab will show you information about those apps and the ones you install yourself. This tab is only useful for seeing which apps are using the most CPU or the most network bandwidth over time.
Click the column title to sort the list by that column. There really isn’t much else you can do on this tab. Right-clicking only lets you jump to the app, which will basically open it if it’s not already open.
Start
One of the most important tabs in the Windows 10 task manager is the Startup tab. In previous versions of Windows, the startup tab was in the MSCONFIG dialog but has since been moved. In Windows 10, you get some extra information about startup items that we’ve never had before.
At the top right, you will see the time of the latest BIOS, which will tell you exactly how long your system was in the BIOS stage before Windows loaded. This is basically the amount of time it takes the system to initialize all the hardware.
Mine is 15 seconds, which is quite long, but that’s okay as I have a custom PC with several hard drives, network cards, USB ports, etc. On a base system, hopefully, the value should be less than 10 seconds.
Below, you will find a list of all startup items on your Windows 10 system. By default, it is sorted alphabetically. I personally like to sort it by the Startup Impact column, as it’s more useful. Windows provides a low to high score based on several factors.
As you can see from my system above, Adobe Creative Cloud has a high impact because it loads 25 different processes on startup. You can click the arrow to expand the list if you want to see all processes included in that program.
To disable a startup item, simply right-click on it and choose Disable.
Note that you can only disable or enable the entire startup item as a single drive. It is not possible to expand it and disable only specific processes or executables. If you are not sure what the startup item is, choose Search Online and you will surely get some information online.
The Startup tab is one of the places you’ll need to come to if you need to do a clean boot of Windows. A clean boot is a troubleshooting technique in Windows that helps you track down a problem in a specific program or process running on your system.
Users tab
Finally, the Users tab in Windows basically tells you what processes are running for each user on the system.
It’s only really useful if you actually have multiple users on your Windows PC. Otherwise, it just lists your account and shows you the same information you would see in the Performance tab. However, if multiple users are logged in and another user hasn’t closed a program, you’ll be able to quickly see if that program is using the resources on your PC.
If you are an administrator, you can also terminate another user’s activity, thus freeing those resources. Obviously, this can cause data loss for the other user, so be careful when closing another user’s process.
So that’s all there is to it in Task Manager in Windows 10. It’s been around for decades and rightfully so. It provides a lot of useful information about your PC and system in real-time and can be very useful for troubleshooting.